Accident And Injury Rate Up Slightly
In June, the Coast Guard published Recreational Boating Statistics 2019, the 61st annual report, with statistics on recreational boating accidents and state vessel registration. This publication is a result of the coordinated effort of the Coast Guard and those states and territories that have Federally-approved boat numbering and casualty reporting systems. These include all states, the District of Columbia, Puerto Rico, Guam, the Virgin Islands, American Samoa, and the Commonwealth of the Northern Mariana Islands. Here are some highlights from the report.
National Incident Numbers
In 2019, the Coast Guard counted 4,168 accidents that involved 613 deaths, 2,559 injuries and approximately $55 million dollars of damage to property as a result of recreational boating accidents. Compared to 2018:
- The number of accidents increased 0.6%.
- The number of deaths decreased 3.2%
- The number of injuries increased 1.9%.
The number of boat registrations nationally remained essentially unchanged.

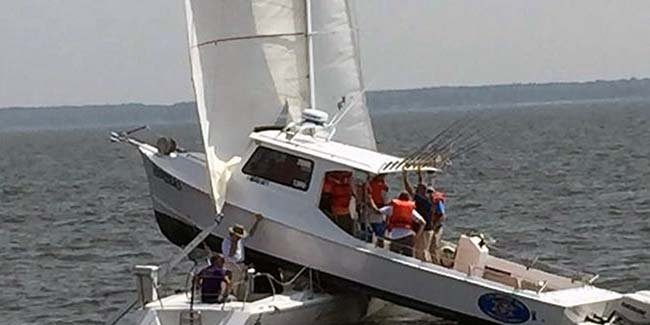
Groundings are the third most common category of boating accidents in South Carolina.
National Incident Rates
The fatality rate was 5.2 deaths per 100,000 registered recreational vessels. This rate represents a 1.9% decrease from the 2018 fatality rate of 5.3 deaths per 100,000 registered recreational vessels.
Drowning Without PFDs A Leading Cause Of Fatalities
Where cause of death was known, 79% of fatal boating accident victims drowned. Of those drowning victims with reported life jacket usage, 86% were not wearing a life jacket.
Alcohol Use Remains The Leading Contributing Factor In Boating Deaths
Where the primary cause of fatalities was known, alcohol use was listed as the leading factor in 23% of deaths.
Other factors in the top five:
- Operator inattention
- Improper lookout
- Operator inexperience
- Excessive speed
The Critical Role Of Boating Safety Instruction
Where instruction was known among victims, 70% of deaths occurred on boats where the operator did not receive boating safety instruction. Only 20% percent of deaths occurred on vessels where the operator had received a nationally-approved boating safety education certificate.

Cabin motorboats are surprisingly almost as often involved in accidents as are personal watercraft.
Types Of Boats Involved In Incidents
The most common vessel types involved in reported accidents were:
- Open motorboats (45%)
- Personal watercraft (19%)
- Cabin motorboats (16%)
The vessel types with the highest percentage of deaths were:
- Open motorboats (48%)
- Kayaks (14%)
- Personal watercraft (8%)
South Carolina
In South Carolina last year, there were 141 reported accidents resulting in 15 deaths; 11 by drowning.
The leading cause of accidents was collisions between boats (41). Other leading causes were:
- Collisions with objects (26)
- Grounding (14)
- Flooding/Swamping (12)
- Falls overboard (9)
What Can We Do To Promote Safe Boating?
In our education and civic service efforts, can LHBC have an effect in our corner of the state? Assuming we follow national trends, we can make an impact with our ABC IF we can get the students to sign up. In the ABC course, we address some of the leading causes of accidents and deaths by:
- Promoting PFD use
- Warning about skippering a boat while impaired
- Training in following COLREGS (rules of the road)
- Keeping lookouts
- Teaching about the skipper’s legal responsibilities
Additionally, our Vessel Safety Check services can promote safety education and engage skippers in addressing shortcomings in many areas of boat operation.
Your comments on the statistics and on what we as a group can do are welcome.
Source: uscgboating.org/statistics/accident_statistics.php.
Photo Credits: BoatUS Foundation


